How Can We Tell Whether Bitcoin Is Cheap or Expensive? Understanding MVRV
MVRV compares Bitcoin’s current market value with the market’s aggregate cost basis estimated from on-chain data. This post explains the difference between MVRV and the MVRV Z-Score, how they are calculated and interpreted, where to find them, and how to use them together with ETF fund flows.

· 11 min read
What Is MVRV? #
Simply put, MVRV is an on-chain indicator that shows how expensive or cheap Bitcoin’s current price is relative to the market’s estimated aggregate cost basis.
Its full name is Market Value to Realized Value.
- Market Value: the current market value
- Realized Value: the realized value estimated from blockchain data
Just as stock investors use ratios such as P/E or P/B to assess whether a stock price is expensive relative to the company’s value, Bitcoin investors can use MVRV to examine how far the current market value has moved away from the aggregate cost basis of market participants.
However, MVRV does not survey the exact purchase price of every investor. Instead, it uses the movement history visible on the blockchain to estimate the market’s cost basis.
How It Is Calculated #
1. MVRV #
MVRV is calculated by dividing Bitcoin’s current market capitalization by its realized capitalization.
$$ \text{MVRV}=\frac{\text{Market Cap}}{\text{Realized Cap}} $$
2. Market Cap #
Market capitalization values every Bitcoin at the current price.
$$ \text{Market Cap}=\text{Current Bitcoin Price}\times\text{Circulating Supply} $$
All else being equal, Bitcoin’s market capitalization rises when its price rises.
3. Realized Cap #
Realized capitalization does not value every Bitcoin at today’s price. It assigns the price at the time each Bitcoin last moved on the blockchain.
For example:
- Bitcoin last moved in 2020: valued at its 2020 price
- Bitcoin moved in 2024: valued at its 2024 price
- Bitcoin moved today: valued at today’s price
Adding these values together produces realized capitalization, an estimate of the network’s aggregate cost basis. It is not an exact average purchase price, but it can serve as a proxy for the price ranges at which investors acquired and continue to hold Bitcoin.
Understanding MVRV with Numbers #
Suppose the market’s estimated cost basis is KRW 60 million per Bitcoin.
If the current price is also KRW 60 million, market participants are, on average, close to break-even.
$$ \text{MVRV}=\frac{\text{KRW 60 million}}{\text{KRW 60 million}}=1 $$
If the current price is KRW 120 million, the current market value is twice the estimated cost basis. In this case, investors have accumulated substantial unrealized gains, so profit-taking pressure may increase.
$$ \text{MVRV}=\frac{\text{KRW 120 million}}{\text{KRW 60 million}}=2 $$
If the current price is KRW 40 million, the market as a whole is close to holding an average unrealized loss. Historically, these periods have often featured fear and capitulation, while also eventually being regarded as long-term undervaluation zones.
$$ \text{MVRV}=\frac{\text{KRW 40 million}}{\text{KRW 60 million}}\approx0.67 $$
How to Interpret MVRV #
Glassnode explains that an MVRV below 1 means a large portion of the market is near break-even or holding a loss, a condition that has often appeared during late-stage bear-market accumulation. Conversely, a high value means unrealized gains have accumulated and the likelihood of selling has increased.
| MVRV | Simple interpretation |
|---|---|
| Below 1 | An undervalued zone where the market is, on average, close to holding a loss |
| Around 1 | The market as a whole is roughly at break-even |
| 1–2 | A profitable range, but not one of extreme overheating |
| 2–3.5 | A rising market with substantial unrealized gains |
| Above 3.5 | A range historically associated with overheating and greater large-scale profit-taking risk |
These thresholds are not absolute buy or sell signals. Market structure and volatility change over time, so even historically important levels may behave differently in the future.
The core principles can be summarized as follows:
- High MVRV: investors have accumulated large gains → the incentive to sell may increase.
- Low MVRV: investors are near break-even or holding losses → the asset may be undervalued, or demand may simply be weak.
A low MVRV is therefore not always positive. It can mean that the price is cheap, but it can also mean that new buying demand is insufficient.
How Is the MVRV Z-Score Different? #
When market commentary refers to MVRV 0.2, below zero, or a green zone, it is often referring to the MVRV Z-Score, not the standard MVRV ratio.
Standard MVRV simply divides market value by realized value. The MVRV Z-Score instead measures how extreme the gap between market value and realized value is relative to historical volatility.
$$ \text{MVRV Z-Score} =\frac{\text{Market Cap}-\text{Realized Cap}} {\text{Standard Deviation of Market Cap}} $$
The easiest way to distinguish them is:
- MVRV: Is the current price expensive relative to the market’s estimated cost basis?
- MVRV Z-Score: How extreme is that difference compared with Bitcoin’s entire history?
| MVRV Z-Score | General interpretation |
|---|---|
| Negative | An extreme undervaluation zone where market value is below realized value |
| 0–1 | A low range that has historically been close to market bottoms |
| 1–3 | A normal range or an advancing bull-cycle range |
| Above 3 | A range where the bull cycle has progressed significantly |
| Upper red zone | A range historically associated with overheating and market tops |
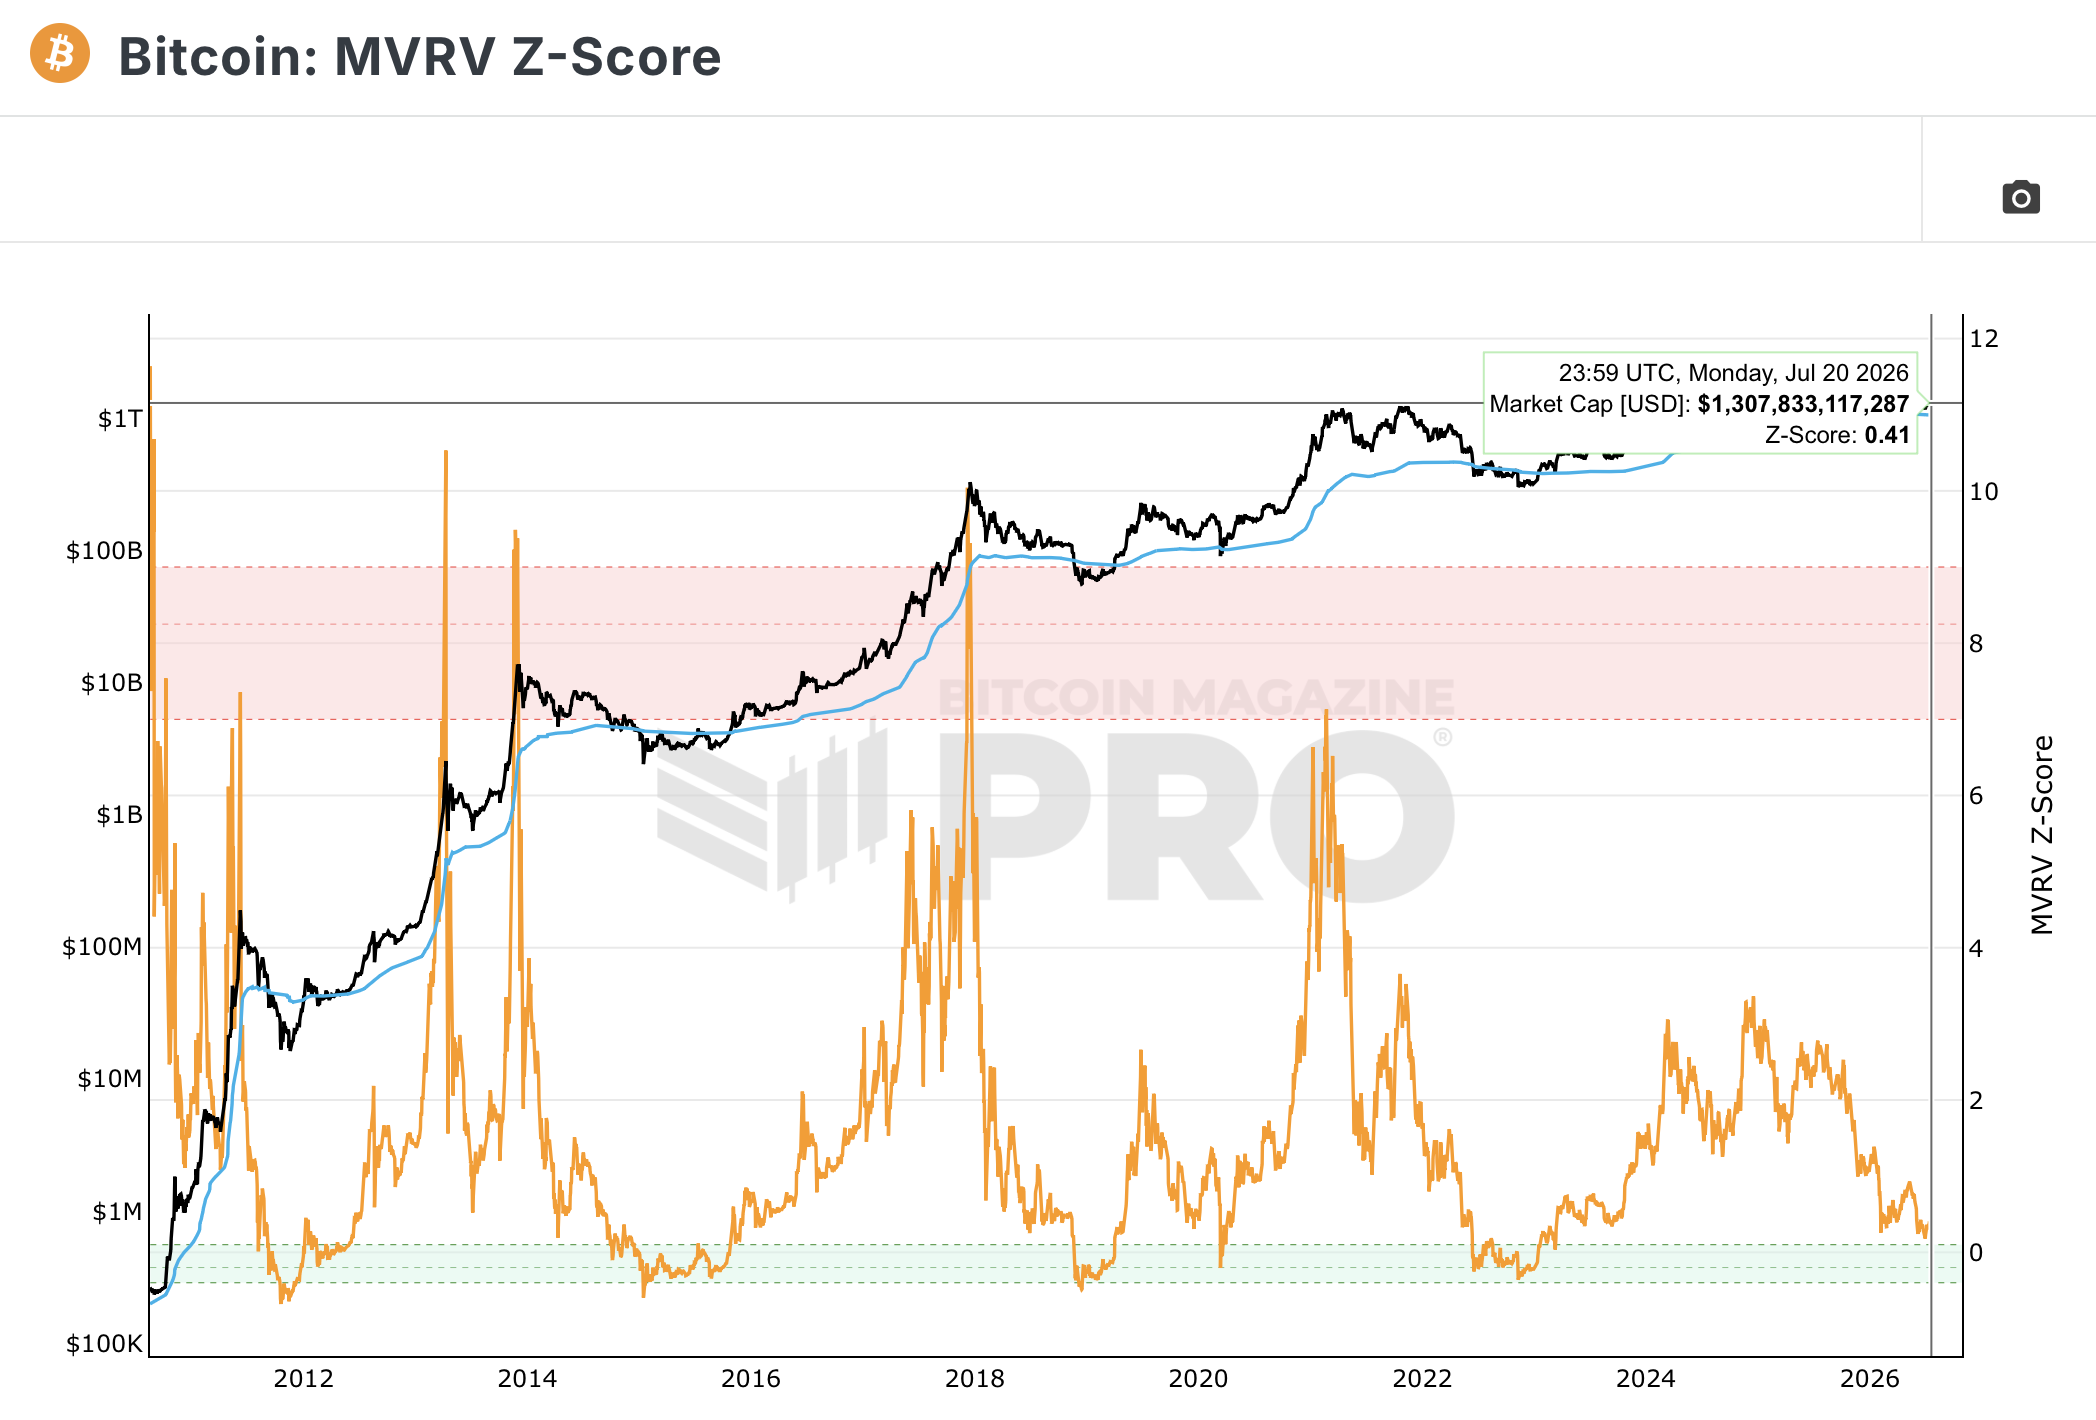
Bitcoin Magazine Pro’s MVRV Z-Score chart shows a red overvaluation zone when market value is far above realized value and a green undervaluation zone when it is far below.
 Source: Bitcoin Magazine Pro — Bitcoin: MVRV Z-Score
As of July 20, 2026, the Bitcoin MVRV Z-Score shown by Bitcoin Magazine Pro was approximately 0.41. By historical standards, this indicates a range with relatively low valuation pressure, but it does not by itself confirm a market bottom or imply an immediate rebound.
Where Can I Check MVRV? #
Glassnode: MVRV Z-Score #
- Bitcoin MVRV Z-Score
- Useful for comparing the current position with Bitcoin’s full historical cycles.
- An account may be required, and some features may be restricted.
Bitcoin Magazine Pro: Color-Coded Zones #
- Bitcoin MVRV Z-Score
- The lower green zone and upper red zone make the chart easier to interpret visually.
CryptoQuant: Standard MVRV Ratio #
- Bitcoin MVRV Ratio
- Suitable for checking the simple ratio between market value and realized value.
- The MVRV Ratio and MVRV Z-Score use different scales and should not be confused.
Is MVRV Used Only for Bitcoin? #
MVRV can be applied not only to Bitcoin but also to Ethereum and some other major on-chain assets. The key requirement is that the blockchain must make it possible to track when coins moved and what their price was at the time.
Bitcoin is the asset for which MVRV has been used the longest. Its data is relatively clear, and it has gone through multiple market cycles, so MVRV tends to be more reliable when applied to Bitcoin.
1. Why It Works Relatively Well for Bitcoin #
Bitcoin uses a UTXO structure. This makes it relatively straightforward to track when each unit of Bitcoin last moved.
- When did it last move?
- What was the market price at that time?
- How much supply has remained dormant for years, and how much moved recently?
This data makes realized capitalization comparatively easier to calculate. Bitcoin’s long history also allows analysts to compare multiple bull and bear markets.
2. What Should We Be Careful About with Ethereum? #
MVRV can also be applied to Ethereum, but Ethereum’s structure is more complicated.
- ETH locked in staking
- ETH deposited in DeFi
- Assets moved to other chains through bridges
- Wrapped assets such as WETH
- Assets held on Layer 2 networks
- Assets traded inside an exchange without moving on-chain
For example, moving ETH into a staking wallet is recorded as an on-chain transfer even if no sale took place. If that movement is treated as a new acquisition, realized value may diverge from investors’ true cost basis.
3. Be Even More Careful with Small-Cap Altcoins #
MVRV can be easily distorted for small-cap altcoins for several reasons:
- A large share of supply is held by the team or foundation
- Locked supply and large token unlocks exist
- Many tokens were distributed through airdrops and have no actual purchase price
- Trading volume and market liquidity are limited
- The asset has a short trading history and few prior cycles for comparison
- A transfer by a single large wallet can materially affect the metric
Bitcoin’s MVRV below 1 threshold should therefore not be applied mechanically to Ethereum or other altcoins. Each asset has a different supply structure and historical range and must be interpreted within its own data.
Do Stocks Have MVRV? #
Stocks generally do not use on-chain MVRV because there is no public ledger showing when and at what price every shareholder acquired their shares.
Instead, other valuation indicators serve a similar purpose.
| Asset | Representative valuation indicators |
|---|---|
| Bitcoin and on-chain assets | MVRV, MVRV Z-Score |
| Stocks | P/E, P/B |
| Real estate | Rental yield, price-to-income ratio |
| Bonds | Yield, credit spread |
P/B is conceptually similar to MVRV because it compares current market value with a company’s book value. However, realized value in MVRV is not the net asset value held by a company. It is the market’s estimated cost basis derived from the price at which coins last moved.
Should I Buy Immediately When MVRV Is Low? #
MVRV helps assess whether the current price is historically cheap. It does not tell us when the price will rise. The following conditions can persist even after MVRV becomes low:
- New capital continues to leave the market
- Macroeconomic and liquidity conditions deteriorate
- Investor capitulation continues
- The price trades sideways at low levels for months
Rather than making a large purchase based on MVRV alone, it is important to check whether actual demand is returning. One useful measure is the flow of funds into U.S. spot Bitcoin ETFs.
Why Look at ETF Fund Flows Together with MVRV?
- MVRV: checks whether Bitcoin is historically cheap
- ETF net inflows: checks whether real investor capital is returning
 Source: Farside Investors — Bitcoin ETF Flow
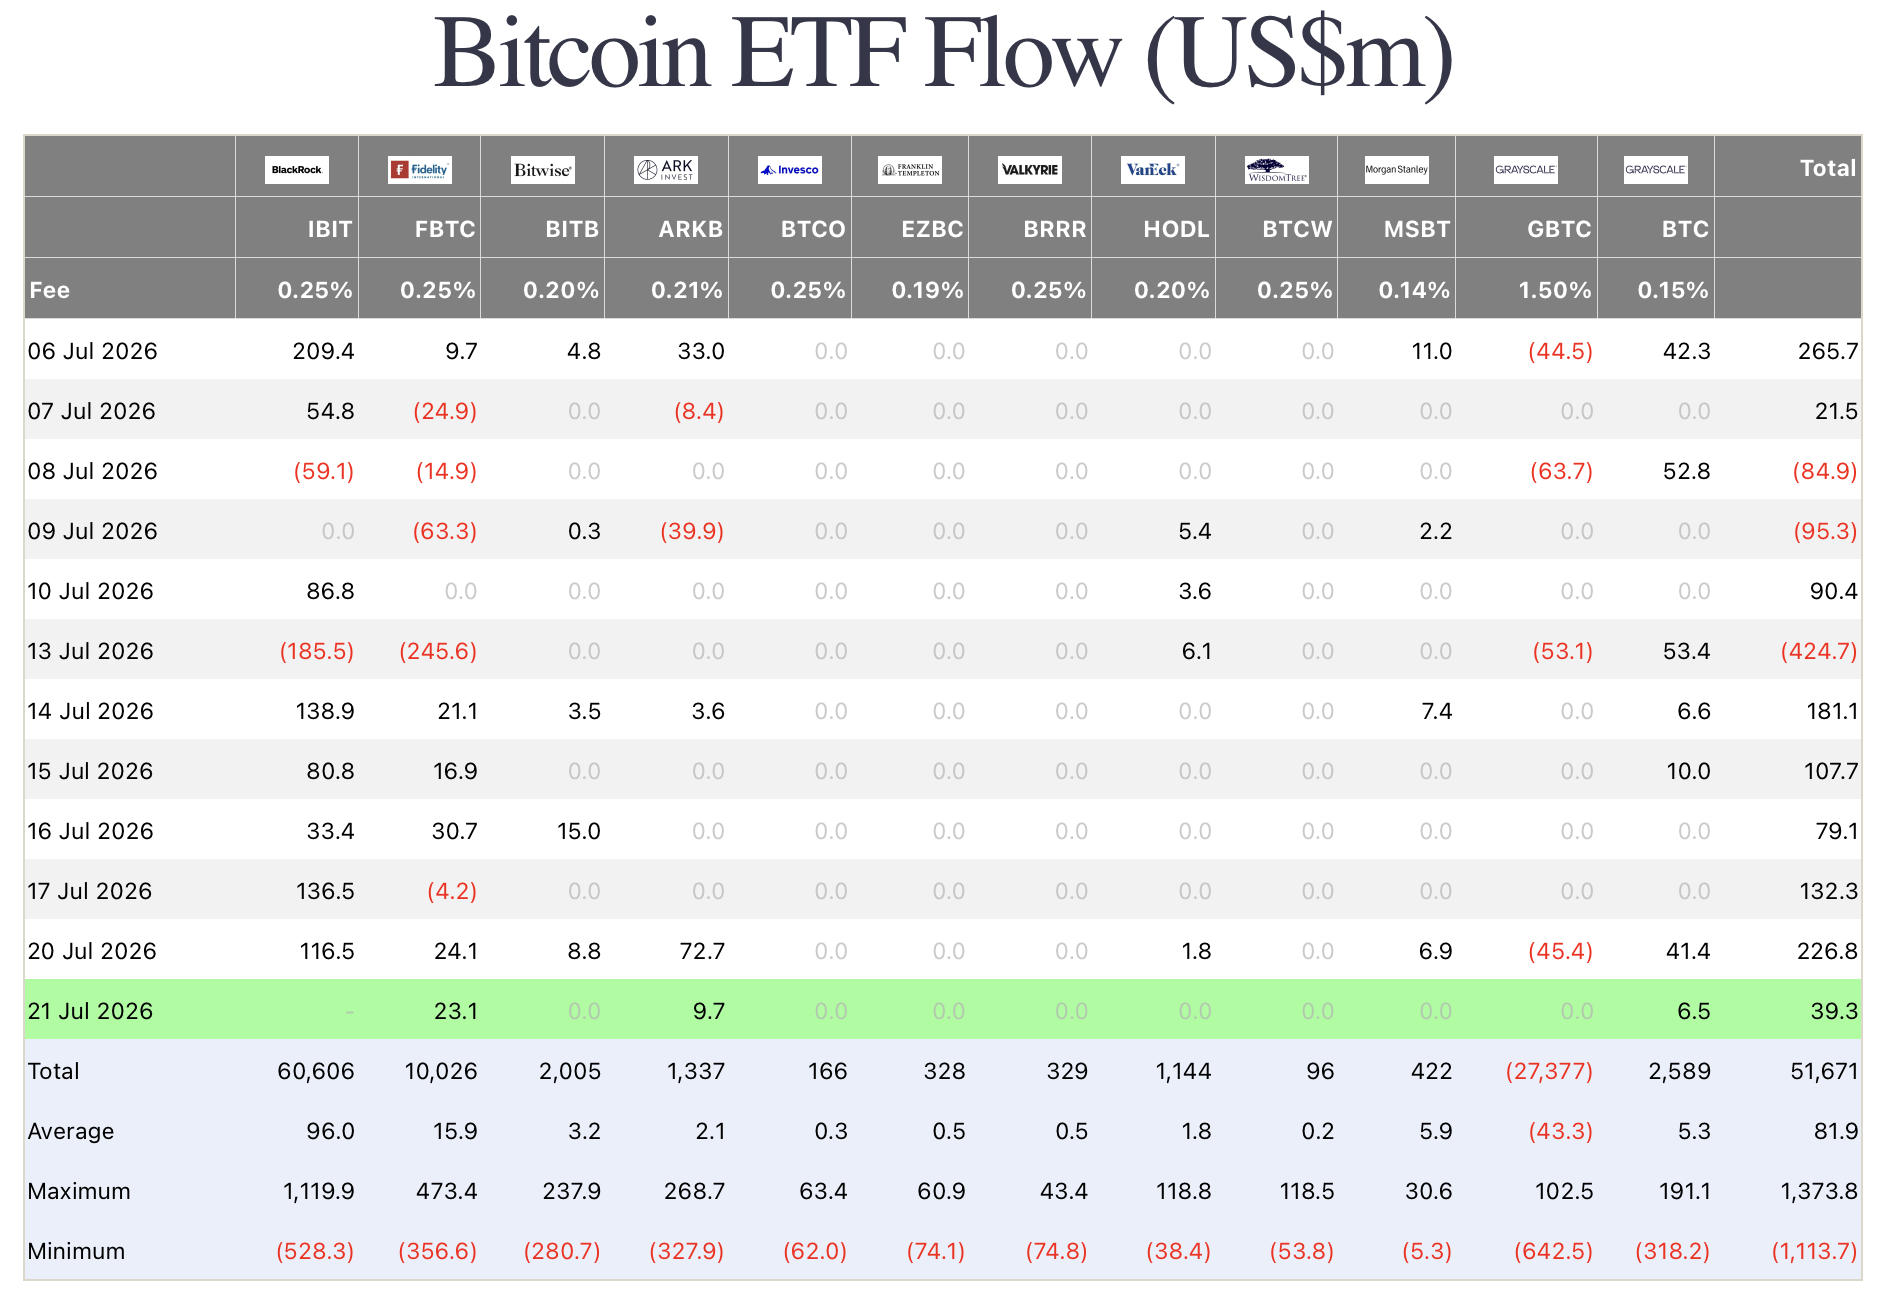
Farside Investors’ Bitcoin ETF Flow shows the daily net flows of U.S. spot Bitcoin ETFs. The far-right Total column can be read as follows:
| Display | Meaning |
|---|---|
226.8 | $226.8 million net inflow across all ETFs on July 20, 2026 |
(95.3) | $95.3 million net outflow across all ETFs on July 9, 2026 |
0.0 | No net inflow or outflow |
- | Data has not yet been reported |
Numbers in parentheses are negative, meaning net outflows. It is important to look not only at BlackRock’s IBIT but at the Total across all ETFs, including products from Grayscale and Fidelity.
From July 14 through July 20, 2026, spot Bitcoin ETFs recorded net inflows for five consecutive trading days, totaling approximately $727 million. This indicated an improvement in short-term spot demand, but it was not proof that Bitcoin’s long-term market bottom had been confirmed.
In practice, the combination can be read as follows:
| Observation | Interpretation |
|---|---|
| Falling MVRV + continued ETF outflows | The price is becoming cheaper, but demand remains weak |
| Low MVRV + ETF flows turn positive | Spot demand may be returning in an undervalued range |
| Low MVRV + 3–5 consecutive trading days of inflows | A somewhat more constructive signal that a bottom may be forming |
| Rising MVRV + price holds its previous low | A stage where a rebound trend may be taking shape |
Importantly, 3–5 trading days is not an official trading rule. It is simply a practical observation window for distinguishing a one-day inflow from a more persistent trend.
Limitations of MVRV #
1. The Last-Moved Price Is Not the Actual Purchase Price
- A coin transfer does not necessarily mean a trade occurred. Realized value can be updated when an individual moves coins between personal wallets or when an exchange reorganizes its internal wallets.
- Conversely, ownership can change inside an exchange without an on-chain movement, leaving no corresponding change on the blockchain.
2. Lost Bitcoin and Long-Dormant Supply
- Bitcoin whose private keys have been permanently lost continues to be valued at its very low historical last-moved price. This supply remains included in realized capitalization and MVRV even though it can no longer be sold.
3. Market Structure Continues to Change
- Spot ETFs and institutional investors are changing how Bitcoin prices are formed. Levels that worked well in earlier cycles are not guaranteed to work the same way in the future.
4. Undervaluation and a Rebound Are Different Things
- A cheap asset can become even cheaper. MVRV shows the market’s valuation state, but it is not a complete indicator that incorporates interest rates, liquidity, regulation, ETF demand, and short-term price trends.
A Simple Monitoring Routine #
There is no need to check MVRV every day. Because it is a long-term cycle indicator, recording the following information about once a week is usually sufficient.
MVRV Ratio: Is it above or below 1?
MVRV Z-Score: Is it in the 0–1 undervaluation range?
ETF five-day total: Net inflow or net outflow?
Bitcoin price: Is it holding the previous low?For example:
MVRV Z-Score: 0.38
ETF flows over the last five trading days: Consecutive net inflows
Price: Holding the previous lowThis combination could be interpreted as Bitcoin carrying relatively low valuation pressure by historical standards while spot demand is beginning to recover. It still does not confirm the bottom in a single step; scaling into a position and seeking further confirmation would remain necessary.
Conclusion #
The core idea behind MVRV is not complicated:
It compares Bitcoin’s current market value with the market’s aggregate cost basis estimated from blockchain data to assess whether the current price is historically expensive or cheap.
- Standard MVRV shows the ratio between market value and realized value. The MVRV Z-Score shows how extreme the gap is compared with Bitcoin’s entire history.
- MVRV is relatively useful for Bitcoin because of its long data history and UTXO structure. For Ethereum and altcoins, staking, DeFi, bridges, lockups, and concentrated supply must also be considered. A low MVRV alone should not be treated as a promise of an immediate rebound.
- The most practical approach is to use MVRV to assess the valuation level, then use ETF inflows and price trends to assess actual demand and whether a rebound is taking shape.